
Table of Contents
Introduction:
Systematic trading is a rule-based approach to trade the market, where decisions are taken by pre-defined strategies instead of emotions or intuition. It allows busy professionals to participate in the markets with minimal time commitment using a structured framework of trading. In discretionary trading, traders make subjective decisions, while systematic trading follows objective, data-driven rules to enter, manage, and exit trades. This blog will help you to understand the key components of systematic trading, compare manual and algorithmic approaches, risk management, and provide real-world examples. Whether you want to trade manually with well-defined rules or automate your strategies using algorithms, this guide will help you master systematic trading.
Key Takeaways
- Systematic Trading Removes Emotion – By using a predefined set of rules, systematic trading eliminates impulsive decisions driven by fear or greed. This leads to more consistent results over time.
- Backtesting is a Must – Before risking real money, testing your strategy on historical data ensures that it has worked in different market conditions and helps refine your entry and exit points.
- Risk Management is Key – Never risk too much capital on a single trade. Use position sizing, stop-loss orders, and risk-reward calculations to protect your account from large losses.
- Automation can Save Time – Busy professionals will benefit greatly from automation. Using simple alerts or algorithmic execution, automation helps you stick to your strategy without constantly monitoring the markets.
- Adaptability is Necessary – No strategy works forever. Regularly evaluate the performance, tweak parameters where necessary, and adjust to evolving market situations to stay profitable.
- Manual and Algorithmic Trading Have Pros and Cons – Manual trading allows for flexibility and intuition, while algorithmic trading provides speed and precision. The best approach depends on your resources and trading style.
- Choose the Right Market and Instruments – Not all assets behave the same way. Select markets where your strategy has a historical edge and offers enough liquidity to execute trades efficiently.
- Keep Strategies Simple and Effective – Overcomplicated strategies often fail in live trading. Stick to simple, well-tested rules that are easy to follow and implement.
- Consistent Evaluation Leads to Improvement – Set aside time to analyze your trades, identify strengths and weaknesses, and refine your approach to improve long-term results.
- Patience and Discipline Lead to Success – Profitable trading requires a long-term mindset. Stick to your strategy, trust the process, and avoid unnecessary changes based on short-term results.
Components of a Systematic Trading Strategy
1. Market Selection
While designing a systematic trading strategy, you must decide which market to trade. Different markets have distinctive characteristics like liquidity, volatility levels that can impact the effectiveness of the strategy.
Key Considerations:
- Liquidity: Highly liquid markets (e.g., Nifty, Bank Nifty) offer tight spreads and better execution.
- Volatility: Some strategies work best in high-volatility conditions (e.g., options selling), while others prefer stable markets (e.g., range-bound strategies).
- Trading Hours: Some markets are 24/5 or 24/7 like Forex and Cryptocurrency, while stock market has fixed trading hours. This affects trade execution and monitoring.
If you are a busy professional who has limited time to watch the market, you may be better off with some swing trading strategies or ETFs, rather than actively trading futures/options intraday.
2. Trading Timeframe
Your trading timeframe determines how long you hold trades and how often you execute them.
Common Timeframes:
- Scalping (Seconds to Minutes): Requires constant monitoring, best for full-time traders. Not very convenient trading manually.
- Day Trading (Minutes to Hours): No overnight exposure, suited for traders who can be active during market hours and can monitor their positions continuously.
- Swing Trading (Days to Weeks): Trades and strategies that can be deployed for a short period of time. Suitable for professionals with limited screen time.
- Position Trading (Weeks to Months): Focuses on macro trends, best for long-term investors.
A Nifty positional trader might use technical indicator-based strategy, entering trades on Monday and reviewing them once a week, while a Bank Nifty intraday trader might use a 5-minute breakout strategy.
3. Entry Criteria
A systematic trading strategy must have clear entry rules that define when a trade should be initiated. Some common entry triggers are explained below.
- Trend Following: Buying when the price moves above a moving average (e.g., 7-day MA) and selling when it moves below in simplest form.
- Mean Reversion: Buying oversold assets (e.g., RSI below 20) and selling overbought ones (RSI above 80).
- Breakouts: Entering trades when price moves above resistance or below support levels.
A simple moving average crossover strategy might buy Nifty when the 5-day MA crosses above the 15-day MA and sell when it crosses below.
4. Exit Criteria
Knowing when to exit is just as important as knowing when to enter. Because only after exit you get result of your trade whether the trade is in profit or loss.
Types of Exits:
- Profit Target: Closing a trade when a predefined profit level is reached (e.g., 5% gain).
- Stop-Loss: Exiting if the price moves against you by a set percentage (e.g., 2% loss).
- Trailing Stop: Adjusting stop-loss levels as the trade moves in your favour to lock in profits.
- Market Reversal: Trade has no edge as market situation reversed.
A Bank Nifty option seller might set a 50% profit target on sold option’s premium while keeping a stop-loss at 2% of the capital deployed.
5. Risk Management
Realistic risk management ensures that you do not lose all your capital on a few bad trades.
Rules and Best Practices:
- Position Sizing: Risking no more than 1-2% of capital per trade.
- Diversification: Trading multiple instruments to reduce exposure to any single trade or market.
- Hedging: Using options or inverse ETFs to protect against losses.
A trader with ₹5,00,000 capital might risk only ₹10,000 (2%) per trade, ensuring they can survive multiple losses without blowing up their account.
6. Type of Trading Strategy
There are several types of systematic trading strategies based on the market situation.
Most Common Strategies are:
- Trend Following: Buying on strength and selling on weakness.
- Mean Reversion: Betting on price returning to its average levels. Mostly used in options.
- Arbitrage: Exploiting price differences in related markets.
- Options Selling: Selling high-premium options to capitalize on time decay.
A Bank Nifty options seller might systematically sell weekly far OTM, high-IV short strangles every Thursday/Friday to capture theta decay.
7. Back Testing and Optimization
A trading strategy must be evaluated on historical data before deploying it in live trading environment.
Back Testing Process:
- Choose a time period (e.g., last 1 to 2 years of Nifty 50).
- Apply your rules to evaluate on historical data.
- Analyse and measure the performance (profit/loss, drawdown, win rate, no of trades etc.).
A trader can back test RSI mean-reversion strategy on Nifty or Bank Nifty and measure the result while buying at RSI < 20 and selling at RSI > 80 for last 2 years.
8. Automation and Execution
Automated execution can be done using some algo platform or customized coding in Python or any other programming language. When you use algorithmic trading, the automation process itself takes care of the trade execution without human intervention.
Automation Types:
- Semi-Automation: Alerts and trade confirmations before actual execution.
- Full Automation: Orders executed automatically via APIs.
A trader can use any third party algo platform to automate the trading logic. Some common platform in India includes TradeTron, AlgoBulls, Algomojo or Streak to execute a Nifty breakout strategy without manual input.
9. Performance Analysis
Regular performance analysis helps improve the trading strategy.
Metrics to Track:
- Win Rate: Percentage of profitable trades.
- Risk-Reward Ratio: Average profit per trade vs. average loss.
- Max Drawdown: Largest drop in the portfolio value.
Trader can review their past 100 trades and based on the findings change the logic that can improve profitability.
10. Adaptability and Continuous Improvement
Market is dynamic and constantly evolving, hence your strategy must evolve with time.
Ways to Improve:
- Review Past Trades: Identify patterns in winning/losing trades and act accordingly.
- Adjust Parameters: Optimize entry, exit, and stop-loss rules to fine tune the trade.
- Evaluate New Markets: Apply the strategy to different indices or assets to check the adaptability.
For example, a trader using Bank Nifty mean reversion notices that trades work best on weekly expiries rather than monthly expiries and adjusts accordingly.
Key Differences: Systematic and Discretionary Trading
Systematic trading and discretionary trading are two different approaches to trading in the financial markets, each with its own set of advantages and disadvantages. Here are the key differences:
Decision-Making Process: One way to differentiate systematic and discretionary trading is their decision-making process. Systematic trading implementation is based on certain rules and logic, but discretionary trading involves human intuition and judgment. System traders create and follow a set of rules, whereas discretionary traders assess current market conditions and decide based on experience, knowledge, and intuition.
Emotional Influence: Systematic trading minimizes the impact of emotions on the decision-making process by adhering to pre-defined rules and algorithms. This in turn stops making impulsive decisions due to fear or greed. On the other hand, discretionary trading is more susceptible to emotional biases, as it always relies on human judgment.
Consistency: As it adheres to a strict set of rules and regulations, systematic trading can provide more consistency in implementing trading strategies. It guarantees for the strategy to be executed as expected thus making it more reliable despite the risk of fluctuations in market moves. In contrast, discretionary trading is often less consistent simply because of the nature of human judgment.
Adaptability: Discretionary traders may have an advantage in rapidly changing market situation, as they can quickly adapt and adjust their strategies based on their experience and understanding of the market. Systematic traders may need to update their rules and algorithms to adapt to new market situations, which can be a more time-consuming and costly process.
Back Testing and Optimization: Historical data makes it easier to back test and optimize systematic trading strategies. This allows traders to evaluate effectiveness of their strategies and modify them accordingly before deploying them in a live trading environment. Since discretion is involved in the decision-making process it is far more difficult to back test and optimize discretionary trading strategies. The human element is difficult to quantify and replicate.
Scalability: Systematic trading strategies are easier to scale since they are rationale-based and can be deployed across multiple markets or asset classes without major customizations. On the other hand, discretionary trading strategies might be more difficult to scale, since they are often based on the skill, experience of the trader.
A Real-World Strategy of Systematic Trading
Now that you know the components of a systematic trading strategy and the difference between systematic and discretionary trading, it is time to explore with a real-world example with Nifty a trading an instrument.
Following the ten different components of developing a trading system as mentioned above, lets create a debit spread strategy using option. Here are the components and their respective input.
- Market Selection: Nifty Index
- Trading Timeframe: Swing Trading (used candlestick chart)
- Entry Criteria: Trend Following
- Exit Criteria: Market Reversal
- Risk Management: Hedging
- Type of Trading Strategy: Trend Following
- Back Testing and Optimization: To be Tested
- Automation and Execution: Manual (Not Automated)
- Performance Analysis: To be Done
- Aadaptability and Continuous Improvement: To be Done
As this is a trend following strategy, “Bull Call Spread” is used for bullish trend and for bearish trend “Bear Put Spread” is used. This is most basic and simple spread strategy for a trend.
Trading Logic for Bull Call Spread:
Chart Set up:
- Nifty 2 hours Heikin Ashi candlestick chart
- Parabolic SAR
- EMA Crossover line
- Short period=5 and long period=15
Trade Entry Criteria:
- When Parabolic SAR is below the Price or
- Short period EMA crosses the long period EMA from below or
- Both the above criteria met
Trade Execution:
- Buy an ATM Call
- Sell an OTM Call (300 to 400 points away)
- DTE (Days to Expiry) should be minimum 21 days, up to 45 days
- No of Lots: based on capital and risk tolerance
Exit Criteria:
- When Parabolic SAR is moved above the Price or
- Short period EMA crosses the long period EMA from above or
- Both the above criteria met or
- 75% of the maximum profit is already reached (or any other %)
Refer the Picutre-1 below, where Nifty 2 hours chart pattern for bullish entry marked by black arrow where entry criteria is met.
Picture-1

Refer Picutre-2 below it shows the same chart without candles for better visibility of PSAR and EMA crossover points for easy identification of trade entry and exit points.
Picture-2

Pay-off Diagram of the Bull Call Spread:

Trading Logic for Bear Put Spread:
Chart Set up:
- Nifty 2 hours Heikin Ashi candlestick chart
- Parabolic SAR
- EMA Crossover line
- Short period=5 and long period=15
Trade Entry Criteria:
- When Parabolic SAR is above the Price or
- Short period EMA crosses the long period EMA from above or
- Both the above criteria met
Trade Execution:
- Buy an ATM Put
- Sell an OTM Put (300 to 400 points away)
- DTE (Days to Expiry) should be minimum 21 days, up to 45 days
- No of Lots: based on capital and risk tolerance
Exit Criteria:
- When Parabolic SAR is moved below the Price or
- Short period EMA crosses the long period EMA from below or
- Both the above criteria met or
- 75% of the maximum profit is already reached (or any other %)
Refer the Picture-3 below where Nifty 2 hours chart pattern for bearish entry marked by red arrow where entry criteria is met.
Picture-3
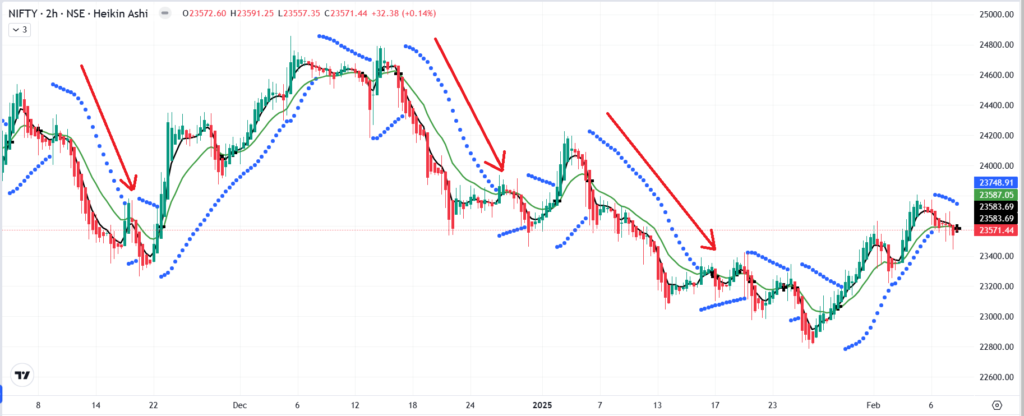
Refer Picture-4 below, it shows the same chart without candles for better visibility of PSAR and EMA crossover points for easy identification of trade entry and exit points.
Picture-4

Pay-off Diagram of the Bear Put Spread:

Please note that there are many ways a systematic trading strategy can be defined and deployed. A simple variation of the above strategy can be a net credit strategy. In the above example net debit strategy is used.
For net credit strategy, traders can use “Bull Put Spread” for bullish direction where an ATM Put is sold and an OTM Put is bought. The spread can be 300 to 400 points for Nifty.
Again, for bearish direction traders can use “Bear Call Spread” where an ATM Call is sold and an OTM Call is bought. The spread can be 300 to 400 points for Nifty.
Common Pitfalls to Avoid in Systematic Trading
Like any trading and investing approach, systematic trading also comes with certain pitfalls. Most common mistakes to avoid include:
- Over Optimization: When designing and developing your trading logic, try avoiding over-optimizing them to fit the historical data. Over optimization often leads to poor performance in live trading. In most cases algorithms may not perform in ever changing market situation.
- Underestimating Risk: Implement your trading algorithm based on your risk tolerance. Most common approach is to use stop-loss at certain levels and most importantly position sizing.
- Ignoring Market Current Situation: Although systematic trading can help you to make decisions objectively, it’s essential to stay informed about broader market trends and other economic, geo-political factors that may impact negatively your trading performance.

Conclusion
Building a systematic trading strategy requires selecting the right market, defining a clear entry and exit rules, managing the risk, back testing, and constantly improving based on performance. By following a structured trading method, traders can achieve consistent profits while reducing emotional decision-making that often leads to negative performance.
Checkout this Podcast for a comprehensive view
FAQs
- What is systematic trading, and how does it differ from discretionary trading?
Systematic trading follows predefined rules and algorithms to make trading decisions, while discretionary trading relies on human judgment and intuition. - Do I need programming skills to implement a systematic trading strategy?
No, but programming skills can help automate strategies. Many platforms, like TradeTron, Streak offer code-free solutions for systematic trading. - How do I know if my trading strategy is profitable?
Back testing on historical data and forward-testing in a simulated environment help determine profitability before live trading. - What is the best timeframe for a systematic trading strategy?
It depends on your risk tolerance and availability. Intraday traders use short timeframes (minutes to hours), while swing and position traders use daily or weekly charts. - How can I minimize drawdowns in systematic trading?
Using risk management techniques like stop-losses, position sizing, diversification, and volatility-based adjustments can help reduce drawdowns. - Which markets are best suited for systematic trading?
Highly liquid markets such as stocks, indices (Nifty, Bank Nifty), forex, and commodities work best due to lower slippage and better execution. - Can systematically trading work in all market conditions?
No strategy works all the time. It’s crucial to test performance across different conditions (trending, sideways, volatile) and have adaptation mechanisms. - How often should I update or tweak my strategy?
Regularly review performance but avoid over-optimization. Small tweaks should be based on statistical evidence, not recent short-term results. - Is systematic trading suitable for beginners?
Yes, systematic trading helps beginners avoid emotional decisions and stick to a structured approach, making it a fantastic way to start trading. - What tools or platforms can I use for systematic trading?
Popular tools include TradingView, TradeTron, Streak, Amibroker, Python, MetaTrader, and broker APIs for automation.